
Gold Price History Chart – Last 30 Days History
Gold prices in Dubai continue to fluctuate daily based on global gold spot rates, currency movements, and regional demand trends.
Gold Price History Chart in Dubai
Understanding gold price history helps users evaluate how gold rates have moved over time rather than relying on a single day’s price. Without historical context, it is difficult to know whether today’s gold price is relatively high, low, or stable. Gold price history solves this problem by providing a clear comparison of past and current rates.
This section presents historical gold price data in Dubai using charts, tables, and trend analysis. It allows users to review market behavior, compare recent prices, and understand long-term movement patterns.
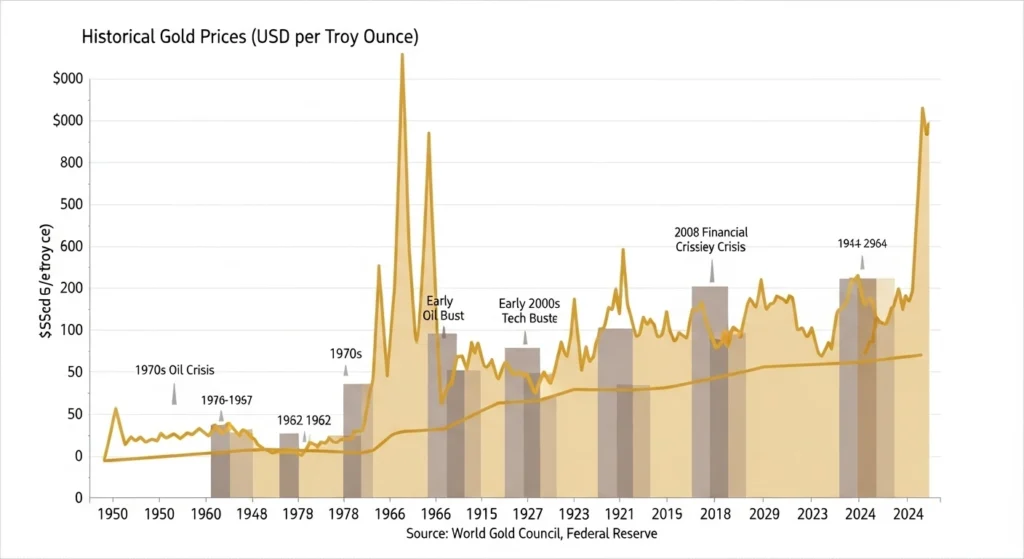
Gold Price History Chart
The gold price history chart visually displays how gold prices in Dubai have changed over time. It helps users quickly identify upward trends, downward movements, and periods of stability.
Charts make it easier to understand price direction compared to raw numbers. By viewing historical price movement, users can see how global market events have influenced gold prices in Dubai.
Gold Market Summary
The gold market in Dubai closely follows international gold price trends due to the USD–AED currency peg. Daily price movements are influenced by global demand, inflation expectations, currency strength, and economic uncertainty.
Recent gold price history shows that gold often reacts quickly to global events. During periods of market volatility, gold prices tend to rise as demand for safe-haven assets increases.
Gold Price History – Last 30 Days
The 30-day gold price history table provides a clear view of recent daily gold rates in Dubai. This table allows users to compare today’s gold price with prices from previous days.
Reviewing a 30-day table helps identify short-term patterns and price consistency. It is especially useful for buyers who want to track daily changes before purchasing gold.
Gold Price Trend Analysis
Gold price trend analysis focuses on how prices have moved over a specific period rather than individual daily values. Short-term trends reflect market reactions, while longer trends show broader economic influence.
Analyzing gold price history helps users understand whether prices are trending upward, downward, or remaining stable. This insight is valuable for timing purchases and understanding market behavior.
Gold Price High and Low Summary
The high and low summary highlights the highest and lowest gold prices recorded during a selected period. This comparison helps users understand the price range and volatility of gold in Dubai.
Knowing historical highs and lows allows users to evaluate how current gold prices compare with recent extremes. It also provides perspective on price stability over time.
Why Gold Price History Matters
Gold price history provides transparency and confidence when reviewing gold rates. It helps users avoid decisions based only on short-term price changes.
By studying historical data, users gain a clearer understanding of market movement, long-term value, and pricing patterns in Dubai’s gold market.
Data Accuracy and Sources
Gold price history data is recorded using daily market snapshots and verified pricing benchmarks. Prices are stored consistently to ensure accurate historical comparison.
For broader historical context and global gold trends, users can refer to internationally recognized sources such as the World Gold Council, which publishes verified gold price data.